一、ELK Stack
对于日志来说,最常见的需求就是收集、存储、查询、展示,开源社区正好有相对应的开源项目:logstash(收集)、elasticsearch(存储+搜索)、kibana(展示),我们将这三个组合起来的技术称之为ELK Stack,所以说ELK Stack指的是Elasticsearch、Logstash、Kibana技术栈的结合。
1.1 Elasticsearch介绍
ElasticSearch是一个基于Lucene的搜索服务器。它提供了一个分布式多用户能力的全文搜索引擎,基于RESTful web接口。Elasticsearch是用Java开发的,并作为Apache许可条款下的开放源码发布,是第二流行的企业搜索引擎。设计用于云计算中,能够达到实时搜索,稳定,可靠,快速,安装使用方便。
1.2 Elasticsearch几个重要术语
NRT
elasticsearch是一个近似实时的搜索平台,从索引文档到可搜索有些延迟,通常为1秒。
集群
集群就是一个或多个节点存储数据,其中一个节点为主节点,这个主节点是可以通过选举产生的,并提供跨节点的联合索引和搜索的功能。集群有一个唯一性标示的名字,默认是el
节点
节点就是一台单一的服务器,是集群的一部分,存储数据并参与集群的索引和搜索功能。像集群一样,节点也是通过名字来标识,默认是在节点启动时随机分配的字符名。当然啦,你可以自己定义。该名字也蛮重要的,在集群中用于识别服务器对应的节点。
节点可以通过指定集群名字来加入到集群中。默认情况下,每个节点被设置成加入到elasticsearch集群。如果启动了多个节点,假设能自动发现对方,他们将会自动组建一个名为elasticsearch的集群。
索引
索引是有几分相似属性的一系列文档的集合。如nginx日志索引、syslog索引等等。索引是由名字标识,名字必须全部小写。这个名字用来进行索引、搜索、更新和删除文档的操作。
索引相对于关系型数据库的库。
类型
在一个索引中,可以定义一个或多个类型。类型是一个逻辑类别还是分区完全取决于你。通常情况下,一个类型被定于成具有一组共同字段的文档。如ttlsa运维生成时间所有的数据存入在一个单一的名为logstash-ttlsa的索引中,同时,定义了用户数据类型,帖子数据类型和评论类型。
类型相对于关系型数据库的表。
文档
文档是信息的基本单元,可以被索引的。文档是以JSON格式表现的。
在类型中,可以根据需求存储多个文档。
虽然一个文档在物理上位于一个索引,实际上一个文档必须在一个索引内被索引和分配一个类型。
文档相对于关系型数据库的列。
分片和副本
在实际情况下,索引存储的数据可能超过单个节点的硬件限制。如一个十亿文档需1TB空间可能不适合存储在单个节点的磁盘上,或者从单个节点搜索请求太慢了。为了解决这个问题,elasticsearch提供将索引分成多个分片的功能。当在创建索引时,可以定义想要分片的数量。每一个分片就是一个全功能的独立的索引,可以位于集群中任何节点上。
分片的两个最主要原因:
a、水平分割扩展,增大存储量
b、分布式并行跨分片操作,提高性能和吞吐量
分布式分片的机制和搜索请求的文档如何汇总完全是有elasticsearch控制的,这些对用户而言是透明的。
网络问题等等其它问题可以在任何时候不期而至,为了健壮性,强烈建议要有一个故障切换机制,无论何种故障以防止分片或者节点不可用。为此,elasticsearch让我们将索引分片复制一份或多份,称之为分片副本或副本。
副本也有两个最主要原因:
- 高可用性,以应对分片或者节点故障。出于这个原因,分片副本要在不同的节点上。
- 提供性能,增大吞吐量,搜索可以并行在所有副本上执行。
总之,每一个索引可以被分成多个分片。索引也可以有0个或多个副本。复制后,每个索引都有主分片(母分片)和复制分片(复制于母分片)。分片和副本数量可以在每个索引被创建时定义。索引创建后,可以在任何时候动态的更改副本数量,但是,不能改变分片数。
默认情况下,elasticsearch为每个索引分片5个主分片和1个副本,这就意味着集群至少需要2个节点。索引将会有5个主分片和5个副本(1个完整副本),每个索引总共有10个分片。
每个elasticsear
1.3 LogStash 介绍
LogStash由JRuby语言编写,基于消息(message-based)的简单架构,并运行在Java虚拟机(JVM)上。不同于分离的代理端(agent)或主机端(server),LogStash可配置单一的代理端(agent)与其它开源软件结合,以实现不同的功能。
  Shipper:发送事件(events)至LogStash;通常,远程代理端(agent)只需要运行这个组件即可;
  Broker and Indexer:接收并索引化事件;
  Search and Storage:允许对事件进行搜索和存储;
  Web Interface:基于Web的展示界面
1.4 LogStash主机分类
- 代理主机(agent host):作为事件的传递者(shipper),将各种日志数据发送至中心主机;只需运行Logstash 代理(agent)程序;
- 中心主机(central host):可运行包括中间转发器(Broker)、索引器(Indexer)、搜索和存储器(Search and Storage)、Web界面端(Web Interface)在内的各个组件,以实现对日志数据的接收、处理和存储。
1.5 Kibana
Kibana是Elasticsearch的开源数据可视化插件,为查看存储在ElasticSearch提供了友好的Web界面,并提供了条形图,线条和散点图,饼图和地图等分析工具
1.6 Beats
Beats 作为轻量级日志数据搜集器。目前 Beats 包括四种:
Packetbeat(搜集网络流量数据);
Topbeat(搜集系统、进程和文件系统级别的 CPU 和内存使用情况等数据);
Filebeat(搜集文件数据);
Winlogbeat(搜集 Windows 事件日志数据);
Beats 将搜集到的数据发送到 Logstash,经 Logstash 解析、过滤后,将其发送到 Elasticsearch 存储,并由 Kibana 呈现给用户 。
二、ELK Stack+FileBeat 工作流
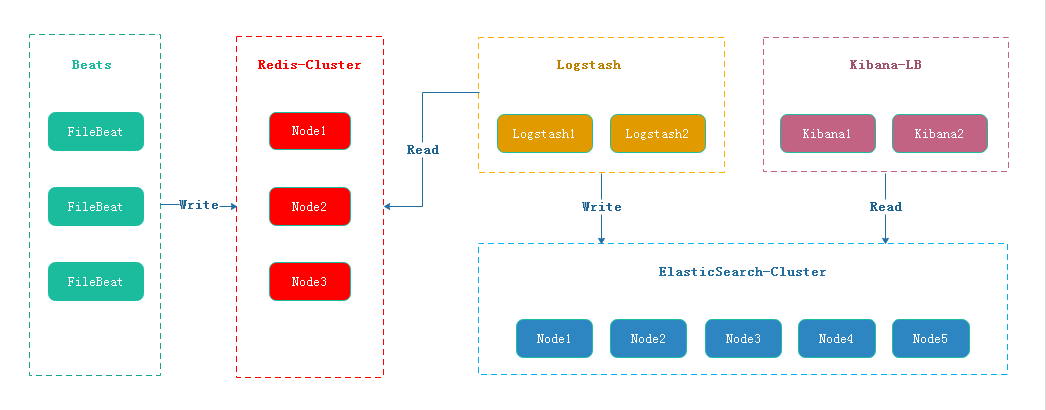
FileBeat 将日志按照约定的Key写入Redis,Logstash从Redis中读取日志信息写入ElasticSearch集群。Kibana读取ElasticSearch中的日志,并在Web页面中以表格/图表的形式展示。
三 、部署工作准备
应用包准备
elasticsearch-7.0.0-linux-x86_64.tar
logstash-7.0.0.tar
kibana-7.0.0-linux-x86_64.tar
filebeat-7.0.0-linux-x86_64.tar
redis-5.0.4.tar.gz
JDK1.8
配置表:
| Hostname | IP | Install APP |
| elk-hot-master1 | 192.168.0.240 | elasticsearch +logstash |
| elk-cold-master2 | 192.168.0.250 | elasticsearch +logstash |
| elk-hot-data1 | 192.168.0.225 | elasticsearch +logstash |
| elk-cold-data2 | 192.168.0.226 | elasticsearch +logstash |
| elk-redis-kibana | 192.168.0.223 | redis+ kibana |
| elk-DAQ-filebeat | 192.168.0.221 | nginx+tomcat+ filebeat |
1、系统环境准备
由于Elasticsearch、Logstash、Kibana均不能以root账号运行。但是Linux对非root账号可并发操作的文件、线程都有限制。
- 修改文件限制
vi /etc/security/limits.conf
#增加的内容
* soft nofile 65536
* hard nofile 65536
* soft nproc 2048
* hard nproc 4096- 调整进程数
#修改系统文件
vi /etc/security/limits.d/20-nproc.conf
#调整成以下配置
*          soft    nproc     4096
root soft nproc unlimited- 调整虚拟内存&最大并发连接
#修改系统文件
vi /etc/sysctl.conf
#增加的内容
vm.max_map_count=655360
fs.file-max=655360- 以上操作重启系统后生效
reboot2、部署JDK、nginx、tomcat环境
部署与配置详情在此略。。。
3、Redis-cluster部署参考
https://www.infvie.com/ops-notes/redis5-cluster
4、创建用户与工作目录
#创建es运行用户
useradd -s /sbin/nologin -M -U elk
#创建数据和日志目录
mkdir -p /data/elk/{es,logstash}/{data,logs}
#目录用户授权
chown -R elk:elk /data/elk/
四、ELKStack+Beats 部署
4.1 Elasticsearch 部署
wget -P /usr/local/elk/ https://artifacts.elastic.co/downloads/elasticsearch/elasticsearch-7.0.0-linux-x86_64.tar.gz
tar -zxf elasticsearch-7.0.0-linux-x86_64.tar.gz && chown -R elk:elk /usr/local/elk/
Elasticsearch开放端口
#增加端口
firewall-cmd --add-port=9200/tcp --permanent
firewall-cmd --add-port=9300/tcp --permanent

#重新加载防火墙规则
firewall-cmd --reload
Elasticsearch节点配置
Elasticsearch 控制节点node1配置[hot data ]
[root@elk-hot-master1 config]# grep -Ev '^$|^[#;]' elasticsearch.yml
cluster.name: es-cluster
node.name: node-1
path.data: /data/elk/es/data
path.logs: /data/elk/es/logs
bootstrap.memory_lock: false
bootstrap.system_call_filter: false
network.host: 192.168.0.240
http.port: 9200
transport.tcp.port: 9300
node.master: true
node.data: true
node.attr.box_type: hot #标识热数据节点
xpack.security.enabled: false
http.cors.enabled: true
http.cors.allow-origin: '*'
http.cors.allow-headers: Authorization,X-Requested-With,Content-Length,Content-Type
client.transport.ping_timeout: 60s
discovery.zen.minimum_master_nodes: 1
discovery.zen.ping_timeout: 120s
discovery.zen.master_election.ignore_non_master_pings: true
cluster.routing.allocation.disk.watermark.low: 85%
cluster.routing.allocation.disk.watermark.high: 90%
indices.fielddata.cache.size: 10%
indices.breaker.fielddata.limit: 30%
discovery.seed_hosts: ["192.168.0.250:9300","192.168.0.240:9300","192.168.0.225:9300","192.168.0.226:9300"]
cluster.initial_master_nodes: ["192.168.0.240:9300","192.168.0.250:9300"]
Elasticsearch 控制节点node2配置[cold data ]
[root@elk-hot-master2 config]# grep -Ev '^$|^[#;]' elasticsearch.yml
cluster.name: es-cluster
node.name: node-2
path.data: /data/elk/es/data
path.logs: /data/elk/es/logs
bootstrap.memory_lock: false
bootstrap.system_call_filter: false
network.host: 192.168.0.250
http.port: 9200
transport.tcp.port: 9300
node.master: true
node.data: true
node.attr.box_type: cold #标识冷数据节点
xpack.security.enabled: false
http.cors.enabled: true
http.cors.allow-origin: '*'
http.cors.allow-headers: Authorization,X-Requested-With,Content-Length,Content-Type
client.transport.ping_timeout: 60s
discovery.zen.minimum_master_nodes: 1
discovery.zen.ping_timeout: 120s
discovery.zen.master_election.ignore_non_master_pings: true
cluster.routing.allocation.disk.watermark.low: 85%
cluster.routing.allocation.disk.watermark.high: 90%
indices.fielddata.cache.size: 10%
indices.breaker.fielddata.limit: 30%
discovery.seed_hosts: ["192.168.0.250:9300","192.168.0.240:9300","192.168.0.225:9300","192.168.0.226:9300"]
cluster.initial_master_nodes: ["192.168.0.240:9300","192.168.0.250:9300"]
Elasticsearch 数据节点node1配置 [hot data ]
[root@elk-hot-data1 config]# grep -Ev '^$|^[#;]' elasticsearch.yml
cluster.name: es-cluster
node.name: node-3
path.data: /data/elk/es/data
path.logs: /data/elk/es/logs
bootstrap.memory_lock: false
bootstrap.system_call_filter: false
network.host: 192.168.0.225
http.port: 9200
transport.tcp.port: 9300
node.master: false
node.data: true
node.attr.box_type: hot #标识热数据节点
xpack.security.enabled: false
http.cors.enabled: true
http.cors.allow-origin: '*'
http.cors.allow-headers: Authorization,X-Requested-With,Content-Length,Content-Type
client.transport.ping_timeout: 60s
discovery.zen.minimum_master_nodes: 1
discovery.zen.ping_timeout: 120s
discovery.zen.master_election.ignore_non_master_pings: true
cluster.routing.allocation.disk.watermark.low: 85%
cluster.routing.allocation.disk.watermark.high: 90%
indices.fielddata.cache.size: 10%
indices.breaker.fielddata.limit: 30%
discovery.seed_hosts: ["192.168.0.250:9300","192.168.0.240:9300","192.168.0.225:9300","192.168.0.226:9300"]
cluster.initial_master_nodes: ["192.168.0.240:9300","192.168.0.250:9300"]
Elasticsearch 数据节点node2配置 [cold data ]
[root@elk-cold-data2 config]# grep -Ev '^$|^[#;]' elasticsearch.yml
cluster.name: es-cluster
node.name: node-4
path.data: /data/elk/es/data
path.logs: /data/elk/es/logs
bootstrap.memory_lock: false
bootstrap.system_call_filter: false
network.host: 192.168.0.226
http.port: 9200
transport.tcp.port: 9300
node.master: false
node.data: true
node.attr.box_type: cold #标识冷数据节点
xpack.security.enabled: false
http.cors.enabled: true
http.cors.allow-origin: '*'
http.cors.allow-headers: Authorization,X-Requested-With,Content-Length,Content-Type
client.transport.ping_timeout: 60s
discovery.zen.minimum_master_nodes: 1
discovery.zen.ping_timeout: 120s
discovery.zen.master_election.ignore_non_master_pings: true
cluster.routing.allocation.disk.watermark.low: 85%
cluster.routing.allocation.disk.watermark.high: 90%
indices.fielddata.cache.size: 10%
indices.breaker.fielddata.limit: 30%
discovery.seed_hosts: ["192.168.0.250:9300","192.168.0.240:9300","192.168.0.225:9300","192.168.0.226:9300"]
cluster.initial_master_nodes: ["192.168.0.240:9300","192.168.0.250:9300"]
Elasticsearch启动&健康检查
- 启动
cd /usr/local/elk/elasticsearch-7.0.0/ && su elk -s /bin/bash -c './bin/elasticsearch'

#./bin/elasticsearch -d 后台运行- 开机自启动
[root@localhost init.d]# more elasticsearch
#!/bin/bash
#chkconfig: 2345 80 05
#description: elasticsearch
export JAVA_HOME=/usr/java/jdk1.8.0_231
export JAVA_BIN=/usr/java/jdk1.8.0_231/bin
export PATH=$PATH:$JAVA_HOME/bin
export CLASSPATH=.:$JAVA_HOME/lib/dt.jar:$JAVA_HOME/lib/tools.jar
export JAVA_HOME JAVA_BIN PATH CLASSPATH

case "$1" in
start)
    su elk<<!
    cd /usr/local/elk/elasticsearch-7.0.0
    ./bin/elasticsearch -d
!
    echo "elasticsearch startup"
    ;;
stop)
    es_pid=`ps aux|grep elasticsearch | grep -v 'grep elasticsearch' | awk '{print $2}'`
    kill -9 $es_pid
    echo "elasticsearch stopped"
    ;;
restart)
    es_pid=`ps aux|grep elasticsearch | grep -v 'grep elasticsearch' | awk '{print $2}'`
    kill -9 $es_pid
    echo "elasticsearch stopped"
    su elk<<!
    cd /usr/local/elk/elasticsearch-7.0.0
    ./bin/elasticsearch -d
!
    echo "elasticsearch startup"
    ;;
*)
    echo "start|stop|restart"
    ;;
esac

exit $?

#加入服务
chkconfig --add elasticsearch
chkconfig elasticsearch on - 查看es健康状态
[root@elk-hot-master1 ~]# curl -X GET http://192.168.0.240:9200
{
  "name" : "node-1",
  "cluster_name" : "es-cluster",
  "cluster_uuid" : "VG6Wq_BPRmKVKCpR1ORhig",
  "version" : {
    "number" : "7.0.0",
    "build_flavor" : "default",
    "build_type" : "tar",
    "build_hash" : "b7e28a7",
    "build_date" : "2019-04-05T22:55:32.697037Z",
    "build_snapshot" : false,
    "lucene_version" : "8.0.0",
    "minimum_wire_compatibility_version" : "6.7.0",
    "minimum_index_compatibility_version" : "6.0.0-beta1"
  },
  "tagline" : "You Know, for Search"
}
[root@elk-hot-master1 ~]# curl -X GET http://192.168.0.250:9200
{
"name" : "node-2",
"cluster_name" : "es-cluster",
"cluster_uuid" : "VG6Wq_BPRmKVKCpR1ORhig",
"version" : {
"number" : "7.0.0",
"build_flavor" : "default",
"build_type" : "tar",
"build_hash" : "b7e28a7",
"build_date" : "2019-04-05T22:55:32.697037Z",
"build_snapshot" : false,
"lucene_version" : "8.0.0",
"minimum_wire_compatibility_version" : "6.7.0",
"minimum_index_compatibility_version" : "6.0.0-beta1"
},
"tagline" : "You Know, for Search"
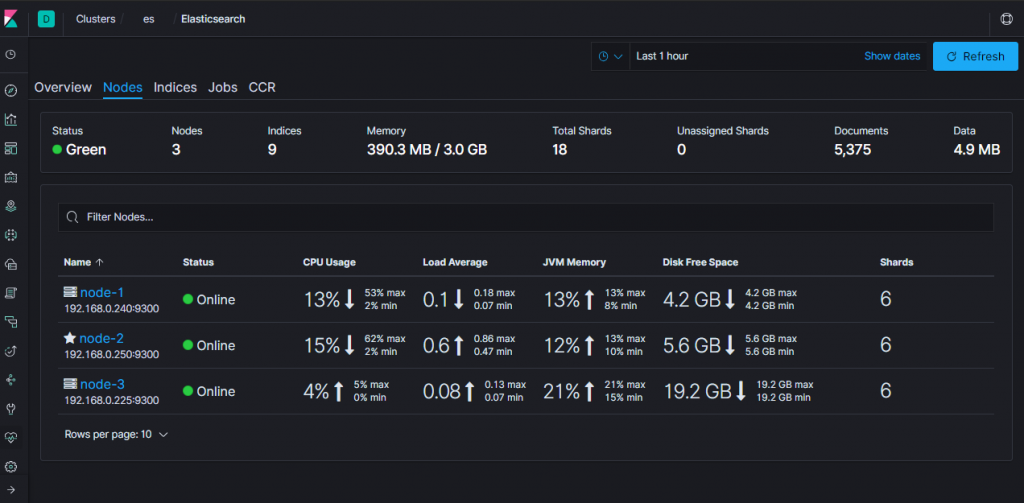
}- 查看cluster健康状态
[root@elk-hot-master1 ~]# curl -X GET http://192.168.0.250:9200/_cluster/health?pretty
{
  "cluster_name" : "es-cluster",
  "status" : "green",
  "timed_out" : false,
  "number_of_nodes" : 4,
  "number_of_data_nodes" : 4,
  "active_primary_shards" : 5,
  "active_shards" : 10,
  "relocating_shards" : 0,
  "initializing_shards" : 0,
  "unassigned_shards" : 0,
  "delayed_unassigned_shards" : 0,
  "number_of_pending_tasks" : 0,
  "number_of_in_flight_fetch" : 0,
  "task_max_waiting_in_queue_millis" : 0,
  "active_shards_percent_as_number" : 100.0
}- snapshot 备份
常见的数据库都会提供备份的机制,以解决在数据库无法使用的情况下,可以开启新的实例,然后通过备份来恢复数据减少损失。虽然 Elasticsearch 有良好的容灾性,但由于以下原因,其依然需要备份机制。
- 数据灾备。在整个集群无法正常工作时,可以及时从备份中恢复数据。
- 归档数据。随着数据的积累,比如日志类的数据,集群的存储压力会越来越大,不管是内存还是磁盘都要承担数据增多带来的压力,此时我们往往会选择只保留最近一段时间的数据,比如1个月,而将1个月之前的数据删除。如果你不想删除这些数据,以备后续有查看的需求,那么你就可以将这些数
版权声明:本文遵循 CC 4.0 BY-SA 版权协议,若要转载请务必附上原文出处链接及本声明,谢谢合作! 据以备份的形式归档。 - 迁移数据。当你需要将数据从一个集群迁移到另一个集群时,也可以用备份的方式来实现。
首先,你要在 elasticsearch.yml 的配置文件中注明可以用作备份路径(即:集群公共存储路径) path.repo ,如下所示:
path.repo: /data/elk/backup/配置好后,就可以在任意master节点使用 snapshot api 来创建一个 repository 了,如下我们创建一个名为 my_fs_backup的 repository。
curl -X PUT "127.0.0.1:9200/_snapshot/my_fs_backup" -H 'Content-Type: application/json' -d'
{
    "type": "fs",
    "settings": {
        "location": "/data/elk/backup/my_fs_backup",
        "compress": true
    }
}
'
有了 repostiroy 后,我们就可以做备份了,也叫快照,也就是记录当下数据的状态。如下所示我们创建一个名为 snapshot_1 的快照
curl -X PUT "127.0.0.1:9200/_snapshot/my_fs_backup/snapshot_1?wait_for_completion=true"4.2 Logstash 部署
wget -P /usr/local/elk/ https://artifacts.elastic.co/downloads/logstash/logstash-7.0.0.tar.gz
tar -zxf logstash-7.0.0.tar.gz && chown -R elk:elk /usr/local/elk/*
Logstash 系统配置
[root@elk-hot-master1 config]# grep -Ev '^$|^[#;]' logstash.yml
 node.name: node-1
 path.data: /data/elk/logstash/data
 path.logs: /data/elk/logstash/logs
Logstash 开放端口
#增加端口
firewall-cmd --add-port=5044/tcp --permanent

#重新加载防火墙规则
firewall-cmd --reload
Logstash 工作流配置
grep -Ev '^$|^[#;]' /usr/local/elk/logstash-7.0.0/config/redis_filebeat_input.conf

input {
  redis{
    host => ["192.168.0.223"]
    port => 6379
    password => "foobared"
    key => "filebeat_online.log"
    data_type => "list"
    add_field => {"id" => "filebeat_online"}
  }
}

filter{

}

output {
    elasticsearch {
        hosts => ["192.168.0.250:9200","192.168.0.240:9200","192.168.0.225:9200","192.168.0.226:9200"]
        index => "logstash-hot-%{type}-%{+YYYY.MM.dd}"
        template_overwrite => true
        }


 stdout {
  }
}
- 启动
#进入Logstash根目录
cd /usr/local/elk/logstash-7.0.0
#启动
su elk -s /bin/bash -c "./bin/logstash -f config/redis_filebeat_input.conf "- 开机自启动
more /etc/init.d/logstash
#!/bin/bash
# Init script for logstash
#chkconfig: 2345 80 05
# Maintained by Elasticsearch
# Generated by pleaserun.
# Implemented based on LSB Core 3.1:
# * Sections: 20.2, 20.3
#
### BEGIN INIT INFO
# Provides: logstash
# Required-Start: $remote_fs $syslog
# Required-Stop: $remote_fs $syslog
# Default-Start: 2 3 4 5
# Default-Stop: 0 1 6
# Short-Description:
# Description: Starts Logstash as a daemon.
### END INIT INFO

PATH=/sbin:/usr/sbin:/bin:/usr/bin
export PATH

if [ `id -u` -ne 0 ]; then
echo "You need root privileges to run this script"
exit 1
fi

name=logstash
pidfile="/var/run/$name.pid"

LS_USER=elk
LS_GROUP=elk
LS_HOME=/var/lib/logstash
LS_HEAP_SIZE="500m"
LS_LOG_DIR=/data/elk/logstash-7.0.0/logs
LS_LOG_FILE="${LS_LOG_DIR}/$name.log"
LS_CONF_DIR=/usr/local/elk/logstash-7.0.0/config
LS_OPEN_FILES=16384
LS_NICE=19
LS_OPTS=""


[ -r /etc/default/$name ] && . /etc/default/$name
[ -r /etc/sysconfig/$name ] && . /etc/sysconfig/$name

program=/usr/local/elk/logstash-7.0.0/bin/logstash
args="agent -f ${LS_CONF_DIR} -l ${LS_LOG_FILE} ${LS_OPTS}"

start() {

LS_JAVA_OPTS="${LS_JAVA_OPTS} -Djava.io.tmpdir=${LS_HOME}"
HOME=${LS_HOME}
export PATH HOME LS_HEAP_SIZE LS_JAVA_OPTS LS_USE_GC_LOGGING

# chown doesn't grab the suplimental groups when setting the user:group - so we have to do it for it.
# Boy, I hope we're root here.
SGROUPS=$(id -Gn "$LS_USER" | tr " " "," | sed 's/,$//'; echo '')

if [ ! -z $SGROUPS ]
then
EXTRA_GROUPS="--groups $SGROUPS"
fi

# set ulimit as (root, presumably) first, before we drop privileges
ulimit -n ${LS_OPEN_FILES}

# Run the program!
nice -n ${LS_NICE} chroot --userspec $LS_USER:$LS_GROUP $EXTRA_GROUPS / sh -c "
cd $LS_HOME
ulimit -n ${LS_OPEN_FILES}
exec \"$program\" $args
" > "${LS_LOG_DIR}/$name.stdout" 2> "${LS_LOG_DIR}/$name.err" &

# Generate the pidfile from here. If we instead made the forked process
# generate it there will be a race condition between the pidfile writing
# and a process possibly asking for status.
echo $! > $pidfile

echo "$name started."
return 0
}

stop() {
# Try a few times to kill TERM the program
if status ; then
pid=`cat "$pidfile"`
echo "Killing $name (pid $pid) with SIGTERM"
kill -TERM $pid
# Wait for it to exit.
for i in 1 2 3 4 5 ; do
echo "Waiting $name (pid $pid) to die..."
status || break
sleep 1
done
if status ; then
if [ "$KILL_ON_STOP_TIMEOUT" -eq 1 ] ; then
echo "Timeout reached. Killing $name (pid $pid) with SIGKILL. This may result in data loss."
kill -KILL $pid
echo "$name killed with SIGKILL."
else
echo "$name stop failed; still running."
fi
else
echo "$name stopped."
fi
fi
}

status() {
if [ -f "$pidfile" ] ; then
pid=`cat "$pidfile"`
if kill -0 $pid > /dev/null 2> /dev/null ; then
# process by this pid is running.
# It may not be our pid, but that's what you get with just pidfiles.
# TODO(sissel): Check if this process seems to be the same as the one we
# expect. It'd be nice to use flock here, but flock uses fork, not exec,
# so it makes it quite awkward to use in this case.
return 0
else
return 2 # program is dead but pid file exists
fi
else
return 3 # program is not running
fi
}

force_stop() {
if status ; then
stop
status && kill -KILL `cat "$pidfile"`
fi
}


case "$1" in
start)
status
code=$?
if [ $code -eq 0 ]; then
echo "$name is already running"
else
start
code=$?
fi
exit $code
;;
stop) stop ;;
force-stop) force_stop ;;
status)
status
code=$?
if [ $code -eq 0 ] ; then
echo "$name is running"
else
echo "$name is not running"
fi
exit $code
;;
restart)

stop && start
;;
*)
echo "Usage: $SCRIPTNAME {start|stop|force-stop|status|restart}" >&2
exit 3
;;
esac

exit $?


chmod +x /etc/init.d/logstash
#加入服务
chkconfig --add logstash
chkconfig logstash on
启动成功后,在启动输出的最后一行会看到如下信息:
[INFO ][logstash.pipeline        ] Pipeline started {"pipeline.id"=>"main"}
[INFO ][logstash.agent           ] Pipelines running {:count=>1, :pipelines=>["main"]}
4.3 FileBeat 部署
wget -p /usr/local/elk https://artifacts.elastic.co/downloads/beats/filebeat/filebeat-7.0.0-linux-x86_64.tar.gz
tar -zxf filebeat-7.0.0-linux-x86_64.tar.gz && mv filebeat-7.0.0-linux-x86_64 filebeat-7.0.0 && chown -R elk:elk /usr/local/elk/
FileBeat配置
more /usr/local/elk/filebeat-7.0.0/filebeat.yml


filebeat.prospectors:

- type: log

  fields_under_root: true

  fields:

    service: tomcat

    app_id: tomcat

    type: tomcat_catalina

  paths:

    - /usr/local/tomcat/logs/catalina.out

  multiline: # 多行合并,将\s+at \w开头的行追加到前一行末尾

     pattern: '^\s+at \w'

     negate: false

     match: after
- type: log #

  fields_under_root: true

  fields:

    service: nginx_access

    app_id: nginx

    type: nginx_access

  paths:

    - /data/wwwlogs/test.cn_nginx.log

  multiline: # 多行合并

     pattern: '^(\d{1,3}){4} \- \- \['

     negate: true

     match: after

     timeout: 10s

- type: log #

  fields_under_root: true

  fields:

    service:  nginx_error

    app_id: nginx

    type: nginx_error

  paths:

    - /data/wwwlogs/error_nginx.log

  multiline: # 多行合并

     pattern: '^\d{4}/\d{2}/\d{2} '

     negate: true

     match: after

     timeout: 10s


output.redis:

    enabled: true

    hosts: ["192.168.0.223"]

    port: 6379

    password: "foobared"

    key: "filebeat_online.log"

    data_type: "list"
- 启动
cd /usr/local/elk/filebeat-7.0.0 && su elk -s /bin/bash -c ./filebeat- 开机自启动
#!/bin/bash
#chkconfig: 2345 80 05
PATH=/usr/bin:/sbin:/bin:/usr/sbin
export PATH
agent="/usr/local/elk/filebeat-7.0.0/filebeat"
args="-c /usr/local/elk/filebeat-7.0.0/filebeat.yml -path.home /usr/local/elk/filebeat-7.0.0 -path.config /usr/local/elk/filebeat-7.0.0 -path.data /usr/local/elk/filebeat-7.0.0/data -path.logs /var/log/filebeat"
test_args="-e -configtest"
test() {
$agent $args $test_args
}
start() {
    pid=`ps -ef |grep /usr/local/elk/filebeat-7.0.0/data |grep -v grep |awk '{print $2}'`
    if [ ! "$pid" ];then
        echo "Starting filebeat: "
        test
        if [ $? -ne 0 ]; then
            echo
            exit 1
        fi
        $agent $args &
        if [ $? == '0' ];then
            echo "start filebeat ok"
        else
            echo "start filebeat failed"
        fi
    else
        echo "filebeat is still running!"
        exit
    fi
}
stop() {
    echo -n $"Stopping filebeat: "
    pid=`ps -ef |grep /usr/local/elk/filebeat-7.0.0/data |grep -v grep |awk '{print $2}'`
    if [ ! "$pid" ];then
echo "filebeat is not running"
    else
        kill $pid
echo "stop filebeat ok"
    fi
}
restart() {
    stop
    start
}
status(){
    pid=`ps -ef |grep /usr/local/elk/filebeat-7.0.0/data |grep -v grep |awk '{print $2}'`
    if [ ! "$pid" ];then
        echo "filebeat is not running"
    else
        echo "filebeat is running"
    fi
}
case "$1" in
    start)
        start
    ;;
    stop)
        stop
    ;;
    restart)
        restart
    ;;
    status)
        status
    ;;
    *)
        echo $"Usage: $0 {start|stop|restart|status}"
        exit 1
esac

#加入服务
chkconfig --add filebeat
chkconfig filebeat on
4.4 Kibana 部署
wget -P /usr/local/elk https://artifacts.elastic.co/downloads/kibana/kibana-7.0.0-linux-x86_64.tar.gz
tar -zxf kibana-7.0.0-linux-x86_64.tar.gz && mv kibana-7.0.0-linux-x86_64 kibana-7.0.0 && chown -R elk:elk /usr/local/elk/- 开放端口
#增加端口
firewall-cmd --add-port=5601/tcp --permanent

#重新加载防火墙规则
firewall-cmd --reload
Kibana配置
grep -Ev '^[#;]|^$' /usr/local/elk/kibana-7.0.0/config/kibana.yml

server.port: 5601
server.host: "192.168.0.223"
elasticsearch.hosts: ["http://192.168.0.250:9200","http://192.168.0.240:9200","http://192.168.0.225:9200","http://192.168.0.226:9200"]- 启动
cd /usr/local/elk/kibana-7.0.0 && su elk -s /bin/bash -c './bin/kibana'- 开机自启动
cat >/usr/local/elk/kibana/bin/startup.sh<<EOF
#!/bin/bash
nohup sh /usr/local/elk/kibana/bin/kibana >> /data/elk/kibana/kibana_logs/kibana.stdout 2>> /data/elk/kibana/kibana_logs/kibana.stderr &
EOF

cat >/usr/local/elk/kibana/bin/shutdown.sh<<EOF
#!/bin/bash
ps -ef|grep node|grep -v grep|awk '{print \$2}'|xargs kill -9
EOF

cat >/etc/init.d/kibana<<EOF
#!/bin/bash
#chkconfig: 2345 80 05
# Description:kibana ORS SERVER
KB_HOME=/usr/local/elk/kibana
PID=$(ps -ef|grep node|grep -v grep|awk '{print $2}')
KB_LOG="/data/elk/kibana/kibana_logs"
KB_START=$KB_HOME/bin/startup.sh
KB_STOP=$KB_HOME/bin/shutdown.sh
#Necessary environment variables
KB_USER=elk
KB_GROUP=elk

[ ! -d "$KB_LOG" ] && mkdir "$KB_LOG"
chown -R "$KB_USER":"$KB_GROUP" "$KB_LOG"
chmod 755 "$KB_LOG"

case $1 in
        start)
        if [ -n "$PID" ]
        then
            echo "Kibana process is already running."
        else
        echo -n "Starting Kibana Server..."
        /bin/su - $KB_USER -s /bin/bash -c $KB_START
        echo " done"
        fi
        ;;
        stop)
        if [ -z "$PID" ]
        then
                echo "Kibana process is not running."
        else
                echo "Stopping Kibana Server..."
        /bin/su - $KB_USER -s /bin/bash -c $KB_STOP
                echo "Kibana Server has been stopped."
        fi
        ;;
        restart)
        $0 stop
        $0 start
        ;;
        *)
        echo "Usage: service $0 {start|stop|restart}" >&2
        exit 1
esac
EOF

#加入服务
chkconfig --add Kibana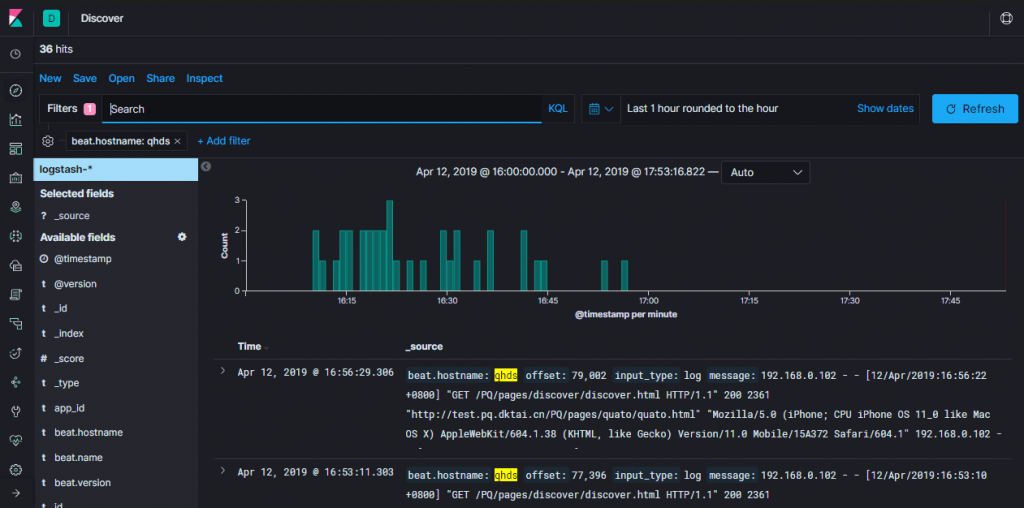
chkconfig Kibana on - 访问
浏览器访问: 192.168.0.223:5601
- 常用命令
查询所有数据:curl http://192.168.0.240:9200/_search?pretty

集群健康状态:curl -X GET http://192.168.0.240:9200/_cluster/health?pretty

删除所有数据:curl -X DELETE 'http://192.168.0.240:9200/_all'

删除指定索引:curl -X DELETE 'http://192.168.0.240:9200/索引名称'
4.5 index template
es数据入库时候都会匹配一个index template,默认匹配的是logstash这个template
template大致分成setting和mappings两部分
- settings主要作用于index的一些相关配置信息,如分片数、副本数,tranlog同步条件、refresh等;
- mappings主要是一些说明信息,大致又分为_all、_source、prpperties这三部分;
根据index name来匹配使用哪个index template. index template属于节点范围,而非全局. 需要给某个节点单独设置index_template(如给设置一些特有的tag).
五、ELK Cerebro 监控工具
Cerebro是一款Elasticsearch可视化监控工具
cerebro 部署
创建用户与安装
#创建运行启动用户
useradd -s /sbin/nologin cerebro

#创建数据和日志目录
mkdir -p /data/cerebro/{data,logs}

#下载与安装
wget -P /usr/local/cerebro/ https://github-production-release-asset-2e65be.s3.amazonaws.com/54560347/60a76100-5790-11e9-845b-c859a95a0b15?X-Amz-Algorithm=AWS4-HMAC-SHA256&X-Amz-Credential=AKIAIWNJYAX4CSVEH53A%2F20190505%2Fus-east-1%2Fs3%2Faws4_request&X-Amz-Date=20190505T075852Z&X-Amz-Expires=300&X-Amz-Signature=cd3706e4bbb01953c283a64e6ab01e2a0528133497ff20045825d94a9ea754e4&X-Amz-SignedHeaders=host&actor_id=0&response-content-disposition=attachment%3B%20filename%3Dcerebro-0.8.3.tgz&response-content-type=application%2Foctet-stream &&
tar xf cerebro-0.8.3.tgz && chown -R cerebro:cerebro /usr/local/cerebro/ /data/cerebro/
修改配置文件
auth.settings #访问Cerebro的用户名及密码
hosts #要监控的Elasticsearch集群,host:节点访问地址,name:标识,一般用ES的cluster_name
tee /usr/local/cerebro/current/conf/application.conf << 'EOF'
secret="ki:s:[[@=Ag?QI`W2jMwkY:eqvrJ]JqoJyi2axj3ZvOv^/KavOT4ViJSv?6YY4[N"
basePath="/"
pidfile.path="/data/cerebro/logs/cerebro.pid"
data.path="/data/cerebro/data/cerebro.db"
es={
    gzip=true
}
auth={
    type: basic
    settings: {
        username="root"
        password="123456"
    }
}
hosts=[
  {
    host="http://192.168.0.240:9200"
    name="es-cluster"
  }
]
EOF
创建服务
tee /etc/systemd/system/cerebro.service << 'EOF'
[Unit]
Description=Cerebro
After=network.target

[Service]
Type=folking
PIDFile=/data/cerebro/logs/cerebro.pid
User=cerebro
Group=cerebro
LimitNOFILE=65535
ExecStart=/usr/local/cerebro/current/bin/cerebro -Dconfig.file=/usr/local/cerebro/current/conf/application.conf
Restart=on-failure
WorkingDirectory=/usr/local/cerebro/current

[Install]
WantedBy=multi-user.target
EOF
常用命令
systemctl daemon-reload;
systemctl enable cerebro;
systemctl start cerebro;
systemctl status cerebro
防火墙设置
firewall-cmd --add-port=9000/tcp --permanent ;
firewall-cmd --reload- 访问验证
port #暴露的端口, 默认端口为9000
address #默认为0.0.0.0,设置为0.0.0.0表示对该主机所有网卡开放
tee -a /etc/systemd/system/cerebro.service << 'EOF'
http = {
    port = "9000"
    address = "192.168.0.240"
}
EOF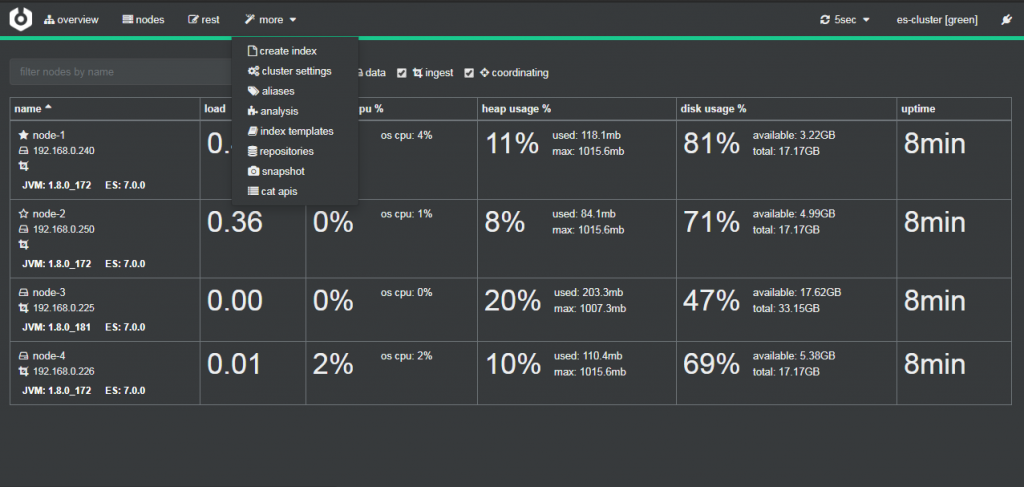
六、ELK 数据冷热分版权声明:本文遵循 CC 4.0 BY-SA 版权协议,若要转载请务必附上原文出处链接及本声明,谢谢合作! 离、数据冷备
- 适合日志类型的数据存储方案。即当日数据写入,历史数据只读。
- 节省部分硬件成本。热数据采用更好的硬件。
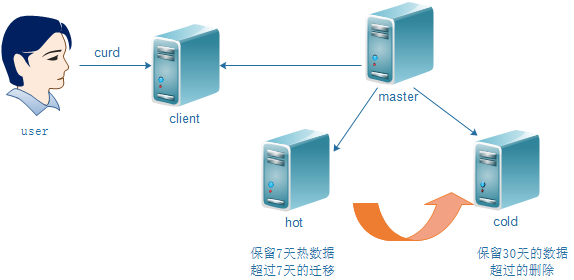
6.1 数据冷热分离
elasticsearch 配置参照上文,以下将从默认模板开始
template_overwrite #布尔类型 默认为false,设置为true表示如果你有一个自定义的模板叫logstash,那么将会用你自定义模板覆盖默认模板logstash利用kibana dev_tools查看已有的模板
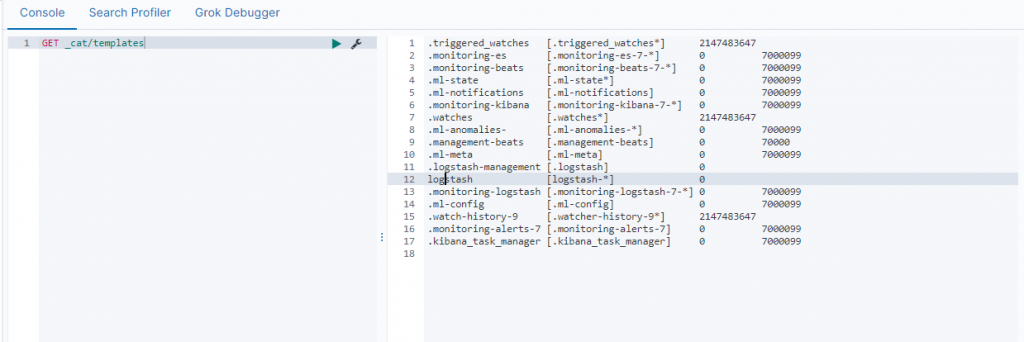
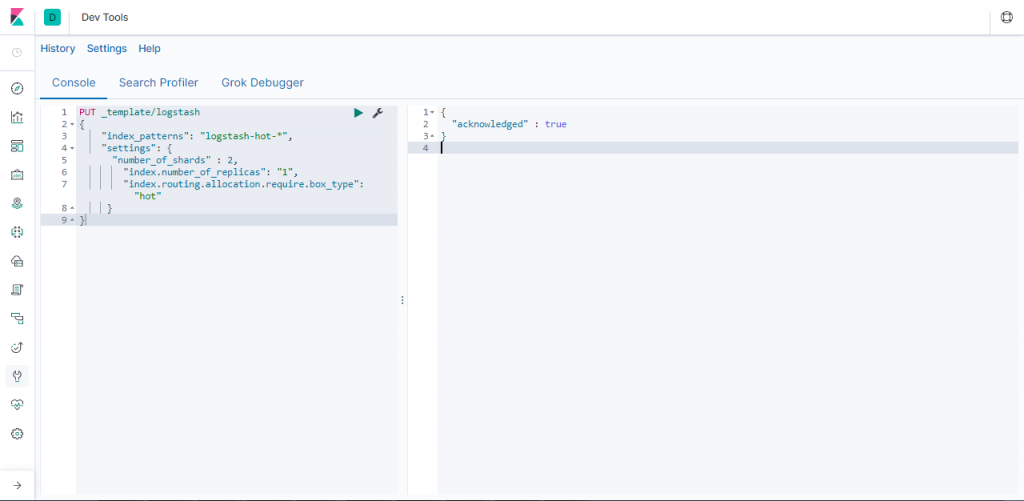
指定默认logstash模板 “index.routing.allocation.require.box_type”为”hot” , 以此实现数据默认放置在热数据节点中存储 。
PUT _template/logstash
{
    "index_patterns": "logstash-hot-*",
    "settings": {
	"number_of_shards" : 2,
        "index.number_of_replicas": "1",
        "index.routing.allocation.require.box_type": "hot"
     }
}
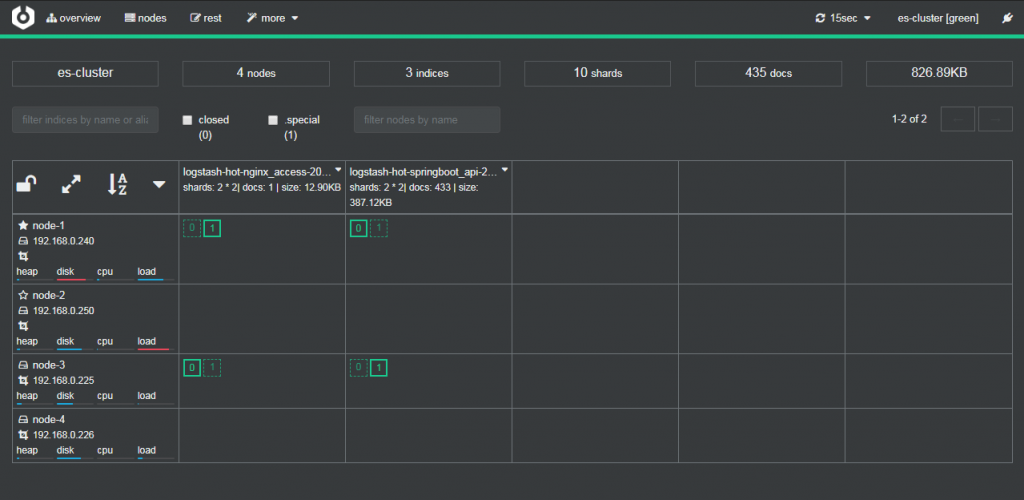
查看修改后的配置
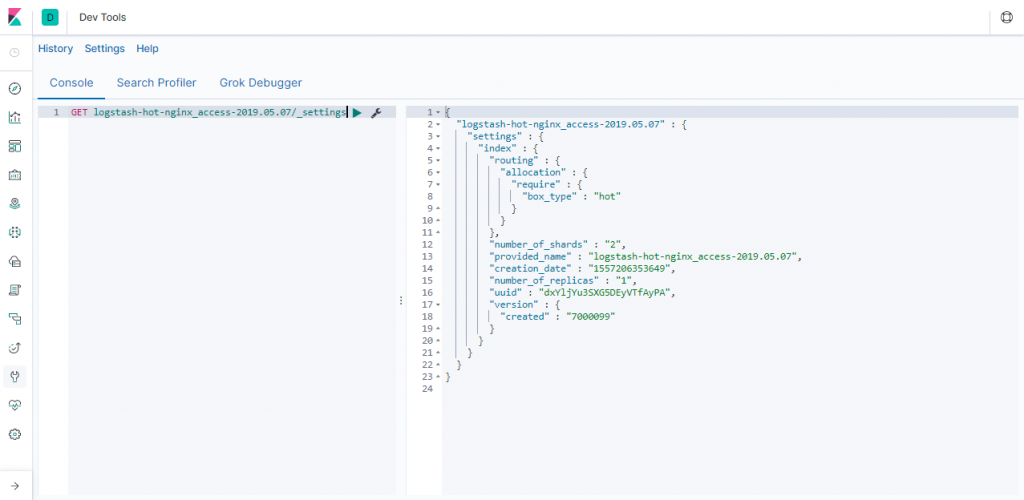
通过可视化集群监控工具cerebro可以查看到默认数据写入node1和node3 hot热数据节点中。
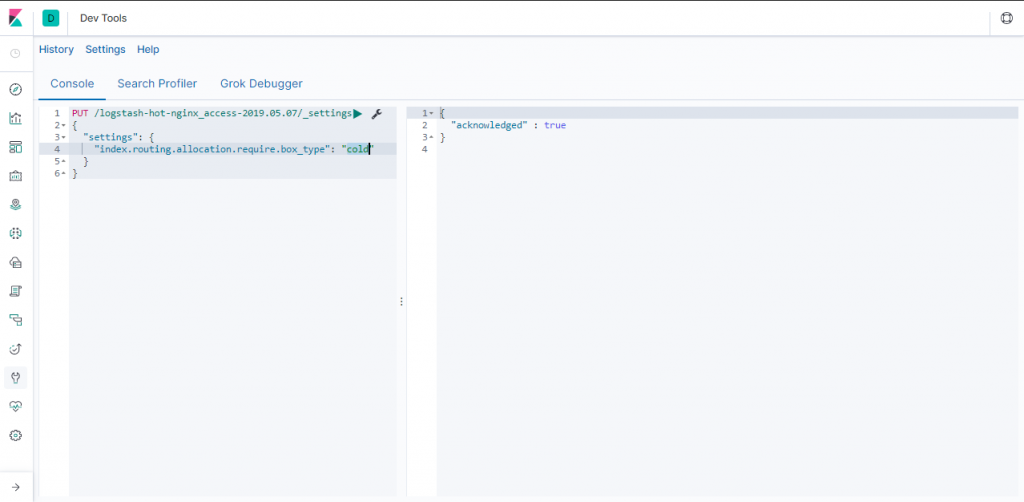
再次指定 index.routing.allocation.require.box_type”为”cold”,让ES自动迁移数据到冷数据节点中存储。
PUT /logstash-hot-nginx_access-2019.05.07/_settings
{
  "settings": {
    "index.routing.allocation.require.box_type": "cold"
  }
}
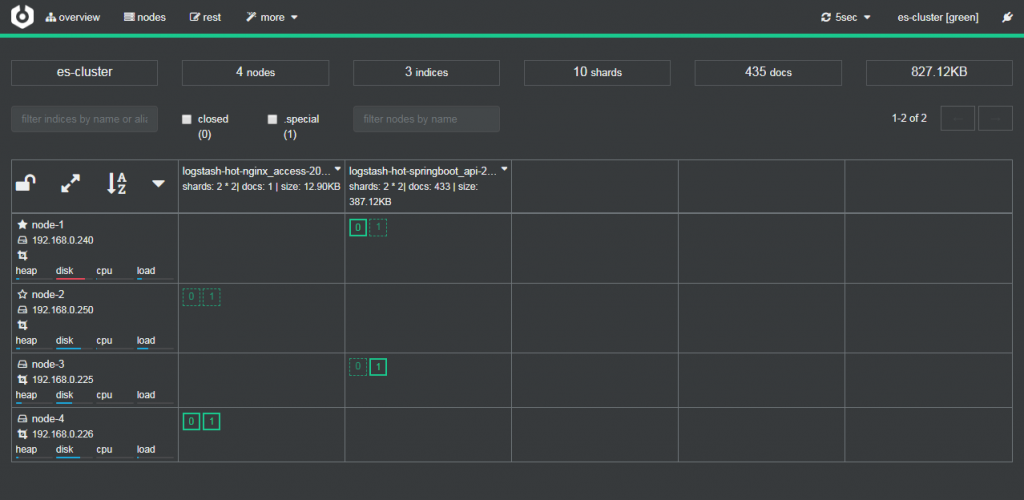
查看修改后的配置

通过可视化集群监控工具cerebro可以查看到默认数据写入node2和node4 cold热数据节点中。
通过shell脚本将Hot数据(保留7天)迁移到Cold
#!/bin/bash
Time=$(date -d "1 week ago" +"%Y.%m.%d")
Hostname=$(hostname)
arr=("cron" "messages" "secure" "tomcat_catalina" "nginx_access" "springboot" "nginx_error" "windows" ".monitoring-es-7" ".monitoring-beats-7" ".monitoring-kibana-7" ".monitoring-logstash-7")
for var in ${arr[@]}
do
    curl -H "Content-Type: application/json" -XPUT http://$Hostname:9200/$var-$Time/_settings?pretty -d'
    {
       "settings": {
             "index.routing.allocation.require.box_type": "cold"
        }
    }'
done
6.2 数据冷备
ES一旦数据被删除将无法通过translog进行数据恢复,所以一定要进行数据冷备。
PUT _snapshot/esbackup# esbackup备份的名称
{
    "type": "fs",
    "settings": {
             "compress": "true",
            "location": "/data/esbackup",
            "max_restore_bytes_per_sec": "50mb",
            "max_snapshot_bytes_per_sec": "50mb"
    }
}
6.3 基于S3 API OSS 数据冷备
- 在集群所有节点进行 repository-s3 插件安装
bin/elasticsearch-plugin install repository-s3 重启所有节点,并验证是否激活插件,如下图则激活
[root@localhost ~]# curl http://127.0.0.1:9200/_nodes?filter_path=nodes.*.plugins|python -m json.tool
  % Total    % Received % Xferd  Average Speed   Time    Time     Time  Current
                                 Dload  Upload   Total   Spent    Left  Speed
100   959  100   959    0     0  60065      0 --:--:-- --:--:-- --:--:-- 63933
{
    "nodes": {
        "0odM2hCTSz6Ty-sqECy7gg": {
            "plugins": [
                {
                    "classname": "org.elasticsearch.repositories.s3.S3RepositoryPlugin",
                    "description": "The S3 repository plugin adds S3 repositories",
                    "elasticsearch_version": "7.0.0",
                    "extended_plugins": [],
                    "has_native_controller": false,
                    "java_version": "1.8",
                    "name": "repository-s3",
                    "version": "7.0.0"
                }
            ]
        },
        "9SdtjQD7RfunW2c1I6PewA": {
            "plugins": [
                {
                    "classname": "org.elasticsearch.repositories.s3.S3RepositoryPlugin",
                    "description": "The S3 repository plugin adds S3 repositories",
                    "elasticsearch_version": "7.0.0",
                    "extended_plugins": [],
                    "has_native_controller": false,
                    "java_version": "1.8",
                    "name": "repository-s3",
                    "version": "7.0.0"
                }
            ]
        },
        "adTlqRqzT9adPT-pziTeHQ": {
            "plugins": [
                {
                    "classname": "org.elasticsearch.repositories.s3.S3RepositoryPlugin",
                    "description": "The S3 repository plugin adds S3 repositories",
                    "elasticsearch_version": "7.0.0",
                    "extended_plugins": [],
                    "has_native_controller": false,
                    "java_version": "1.8",
                    "name": "repository-s3",
                    "version": "7.0.0"
                }
            ]
        }
    }
}
然后,我们需要将OSS使用的Access Key和Secret Key配置到ES去,分别执行下面的命令:
bin/elasticsearch-keystore add s3.client.default.access_key
bin/elasticsearch-keystore add s3.client.default.secret_key
chown -R elk:elk /usr/local/elk
设置ES的_snapshot快照备份ossbackup为OSS的Bucket的objects备份目录
curl -X POST http://127.0.0.1:9200/_snapshot/ossbackup -H 'Content-Type: application/json' -d '{
   "type": "s3",
    "settings": {
        "endpoint": "oss-cn-shanghai.aliyuncs.com",
        "bucket": "ossbackup",
        "compress": true,
        "max_restore_bytes_per_sec": "50mb",
        "max_snapshot_bytes_per_sec": "50mb",
        "base_path": "snapshot/"
    }
}'|python -m json.tool
查询ES备份设置
[root@localhost elasticsearch]# curl -X GET http://127.0.0.1:9200/_snapshot/_all|python -m json.tool
  % Total    % Received % Xferd  Average Speed   Time    Time     Time  Current
                                 Dload  Upload   Total   Spent    Left  Speed
100   395  100   395    0     0  53661      0 --:--:-- --:--:-- --:--:-- 65833
{
    "ossbackup": {
        "settings": {
            "base_path": "snapshot/",
            "bucket": "ossbackup",
            "compress": "true",
            "endpoint": "oss-cn-shanghai.aliyuncs.com",
            "max_restore_bytes_per_sec": "50mb",
            "max_snapshot_bytes_per_sec": "50mb",
        },
        "type": "s3"
    },
    "esbackup": {
        "settings": {
            "compress": "true",
            "location": "/data/esbackup",
            "max_restore_bytes_per_sec": "50mb",
            "max_snapshot_bytes_per_sec": "50mb"
        },
        "type": "fs"
    }
}
创建一个索引为infvie的备份
curl -X PUT http://127.0.0.1:9200/_snapshot/ossbackup/snapshot_1 -H 'Content-Type: application/json' -d '{
        "indices": "infvie"
}'
然后,我们可以从OSS控制台看到备份的结果

七、分片机架感知
按官网介绍,Shard allocation awarenes
启用配置
启动的时候给节点配置节点自定义属性loc
# Add custom attributes to the node:
  node.attr.rack: r1
发起集群强制分片感知
PUT _cluster/settings
{
  "persistent": {
    "cluster.routing.allocation.awareness.attributes": "loc",
    "cluster.routing.allocation.awareness.force.zone.values": [
      "r1",
      "r2"
    ]
  }
}
发起索引分片分配
PUT test_rack/_settings
{
  "index.routing.allocation.include.loc": "r1"
}
查看节点分片数据,可以看到主副分片都不会同时分布在同一个区域的节点
GET /_cat/shards参考文献
https://www.elastic.co/guide/en/logstash/current/configuration.html
https://www.elastic.co/guide/en/elasticsearch/reference/current/index.html
https://blog.csdn.net/wang909125961/article/details/87937335https://www.jianshu.com/p/f53da7e6469c
很全面的一篇教程,十分感谢
不知道有没有多台机器 搭建集群的教程?
试着做了单台多节点的 感觉比较简单
多台机器的时候 一些参数不太清楚 所以想请教一下